Crime

 CRIME
CRIME
| WORSENING TREND |
(Note: trend indicator above is relative to 2007 WPI baseline year.)
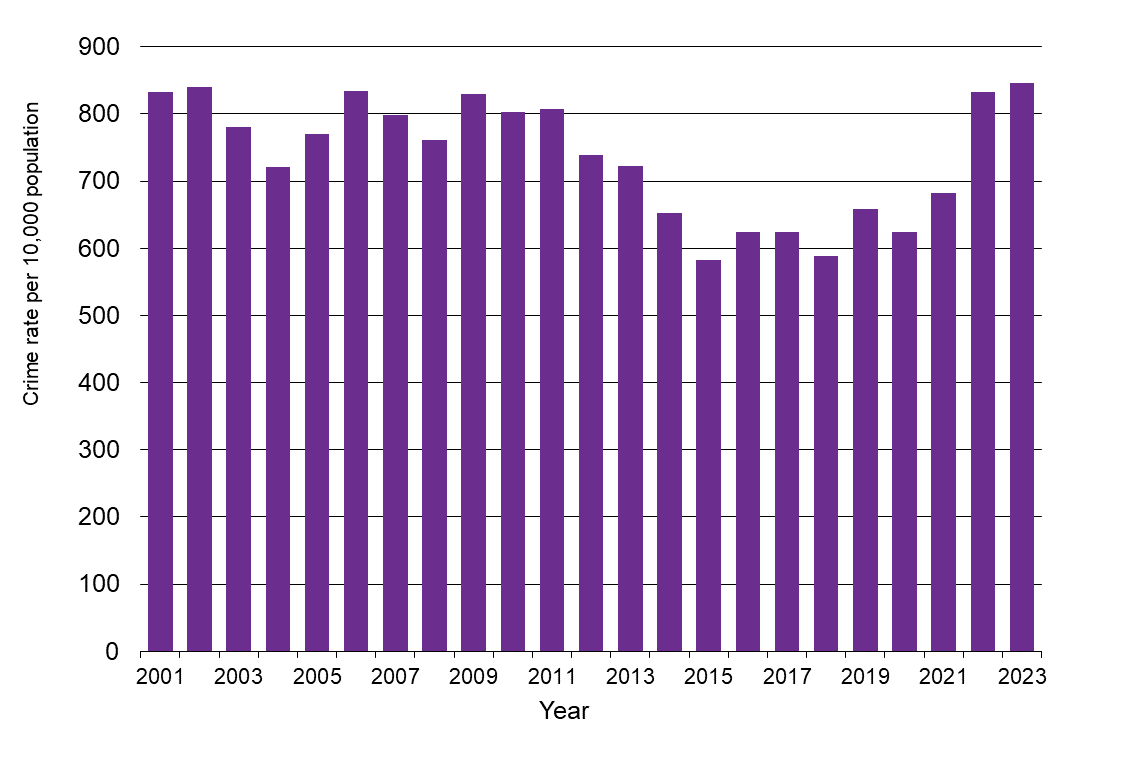
Following a sustained period of low crime in recent years, the annual number of victimisations per 10,000 population in the Waikato region has increased.
This indicator is the number of reported crimes (victimisations) in the Waikato Police District per 10,000 population per year, based on New Zealand Police data on recorded offences and Waikato region population estimates.
Why is this indicator important?
Crime is a topic of considerable public interest. Rising levels of reported crime are perceived as a threat to safety, property and people’s sense of wellbeing. This can influence people’s decisions on where and how they live. Higher levels of crime may also lead to increased pressure on support systems and other resources (for example, physical and mental healthcare services, financial assistance from the government or charities).
Crime

Source: For 2015 onwards, data are from New Zealand Police victimisation data combined with territorial authority population estimates from Statistics New Zealand. Prior figures are estimated from historical trends in rates of recorded offences.
| Year | Rates of recorded crime per 10,000 population |
| 2001 | 832 |
| 2002 | 841 |
| 2003 | 780 |
| 2004 | 721 |
| 2005 | 770 |
| 2006 | 834 |
| 2007 | 798 |
| 2008 | 761 |
| 2009 | 829 |
| 2010 | 803 |
| 2011 | 807 |
| 2012 | 739 |
| 2013 | 722 |
| 2014 | 653 |
| 2015 | 583 |
| 2016 | 625 |
| 2017 | 624 |
| 2018 | 589 |
| 2019 | 661 |
| 2020 | 628 |
| 2021 | 689 |
| 2022 | 842 |
| 2023 | 856 |
| 2024 | 861 |
What is this indicator telling us?
- Changes in the number of crimes recorded annually in the Waikato region generally reflect the national trend. In recent years there has been an increase in the number of recorded victimisations per 10,000 population, following a prior period with record low levels of crime. Dishonesty offences in the form of theft, unlawful entry, robbery and related offences regularly account for more than half of all recorded crime. Recent years have seen a rapid increase in these types of offences.
- Care needs to be taken in the interpretation of reported crime statistics over time as they may be affected by changes in public reporting rates (e.g. due to greater awareness and reporting of family violence) and police administrative changes.
- Comparing across the Waikato territorial authorities, the highest rate of crime victimisation in the year ended December 2024 was in Hamilton (1,314 persons/organisations/premises victimised per 10,000 resident population) and the lowest in Waikato district (487 per 10,000) and Ōtorohanga (498 per 10,000).
- New Zealand has one of the lowest crime rates in the world (assaults and homicide rates). According to the latest OECD data, New Zealand's homicide rate is 1.3 per 100,000 people, significantly lower than the OECD average of 2.6.
DATA SOURCE AND SUPPORTING INFORMATION
Victimisation trend data are available online at policedata.nz. Source page for counts is Victimisations (police stations), toggled from the ‘Districts’ tab. Data compiled 24 March 2024 (note the data may be revised retrospectively). Waikato regional count is the sum of victimisations at the territorial authority level (excluding Rotorua). These were divided by estimated population from Stats NZ, then multiplied by 10,000 to arrive at a crime rate estimate for each TA and hence the region as a whole.
New Zealand’s crime statistics were transformed from 2014/15, resulting in new measures and trends. WPI worked with NZ Police guidance to develop its approach to calculating regional trend series for the period pre-July 2014.
Further information about offence and victimisation trends is available from a New Zealand Parliament Research Paper.
Territorial authority figures were compiled from New Zealand Police data.
Update details: Annual calendar year victimisation data are reported to 2024, with 2025 results and corresponding population estimate available in early 2026.
Customised data request requirements: Nil.
DATA AVAILABILITY – OTHER THAN WAIKATO REGION:
Territorial Authority (TA) disaggregation: Yes
Other regions: Yes
New Zealand: Yes
Other countries/ Organisation for Economic Co-operation and Development (OECD): Secondary statistics from the OECD Wellbeing Report: Safety – Key findings. In particular, the OECD findings state that: ‘New Zealand’s homicide rate is 1.3, lower than the OECD average of 2.6. New Zealand ranks 27/41 on homicide rate amongst the OECD countries.


