"The demonstration day was awesome! We invited some of our Treaty partners, local schools, and mana whenua/tangata tiaki to share in the experience, share some kōrero, and share contacts."
- Tama Blackburn, Taiao Project Manager at Te Nehenehenui (TNN).

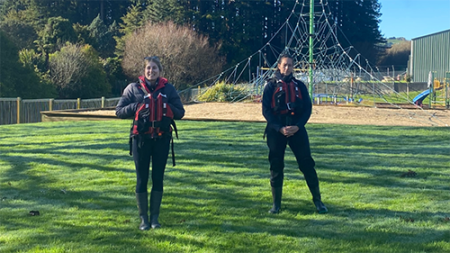
Environmental monitoring scientists Loren Harvie and Jessie Tawhai giving a briefing at the hydrology demonstration day in Te Kūiti.
Meet Jessie and Loren, two of the hydrology team’s environmental monitoring scientists. Each month, they check in on their assigned rainfall, river level and river flow sites. “We have unusual work environments, and every day is different,” says Loren.
One day last April, Jessie and Loren were busy measuring the flow rate of the Mangaokewa Stream in Te Kūiti, when local Tama Blackburn and his 11-year-old son Epiha were walking past and wondered what was going on.
No matter how tricky their work, the hydrology team say they’re always happy to have a yarn with locals and explain what they’re working on.

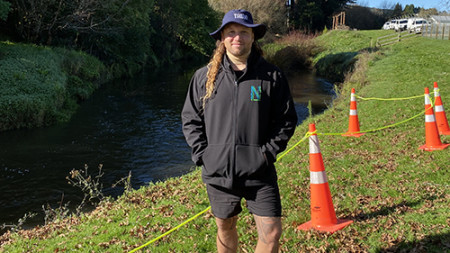
Tama Blackburn, Taiao Project Manager at Te Nehenehenui
Tama, who serves as Taiao Project Manager at Te Nehenehenui (TNN), says it was great to meet Jessie and her team. Epiha and Tama are passionate about caring for the taiao, and the Mangaokewa Stream is of special interest to them as it travels through the township of Te Kūiti.
When they spotted somebody in the awa, they thought they should introduce themselves and see what was happening. Jessie and Loren were conducting some measurements with a gadget that Epiha and Tama hadn’t seen before.
“We thought, if I’ve never seen this stuff before, then it’s highly likely that other members of our community haven’t either,” says Tama.
This sparked the idea of a demonstration day where tamariki and rangatahi from local kura and schools, representatives from local Department of Conservation offices, and other local authorities could gather to learn more about the mahi Waikato Regional Council’s hydrology team does in the area.
“The demonstration day was awesome! We invited some of our Treaty partners, local schools, and mana whenua/tangata tiaki to share in the experience, share some kōrero, and share contacts. The weather was absolutely fabulous for a winter’s day; he rangi mokopuna!” says Tama.
“The tamariki/rangatahi were both inspired and inspiring. They had a go at operating some of the technology and were really good at it. Perhaps there is a positive to video games?
“We truly appreciate the opportunity that Waikato Regional Council offered, and we look forward to strengthening our relationship with them and creating more opportunities for our iwi and communities.”
So, how do you accurately measure something that’s always changing?
It’s not easy.
The hydrology team uses a multitude of methods for river gauging and rainfall to make sure they get the most accurate measurements for each site.
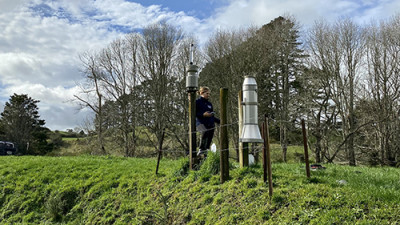
When it comes to rainfall, intensity gauges that have 0.5mm tipping buckets. When these fill up, the buckets tip and we just count the tips to calculate how much rain has fallen.
Water level measurements range from the relatively simple, like a staff gauge (that’s those things that look like giant rulers sticking out of a riverbed) to using a laser from a bridge. Flow measurements use more high-tech tools like an acoustic doppler current profiler (ADCP).

Loren measuring rainfall with a rain gauge.
A what?! Can you remember learning about the Doppler effect at school?
ADCPs are instruments that use the Doppler effect by sending out short bursts of sound; let’s call them ‘pings’. These pings ricochet off particles floating in the water and are reflected back to the instrument. When particles are moving away from the profiler, they produce a lower frequency pitch compared to those moving towards it. By measuring the difference between the sound waves the ADCP sends out and the waves it gets back, we can work out how fast a particle (and the water around it) are moving. The system then tracks the time it takes for each ping to return, providing current data across different depths.
ADCPs use a series of acoustic transducers that emit and receive these pings from different directions. This means we can build an accurate water velocity profile.
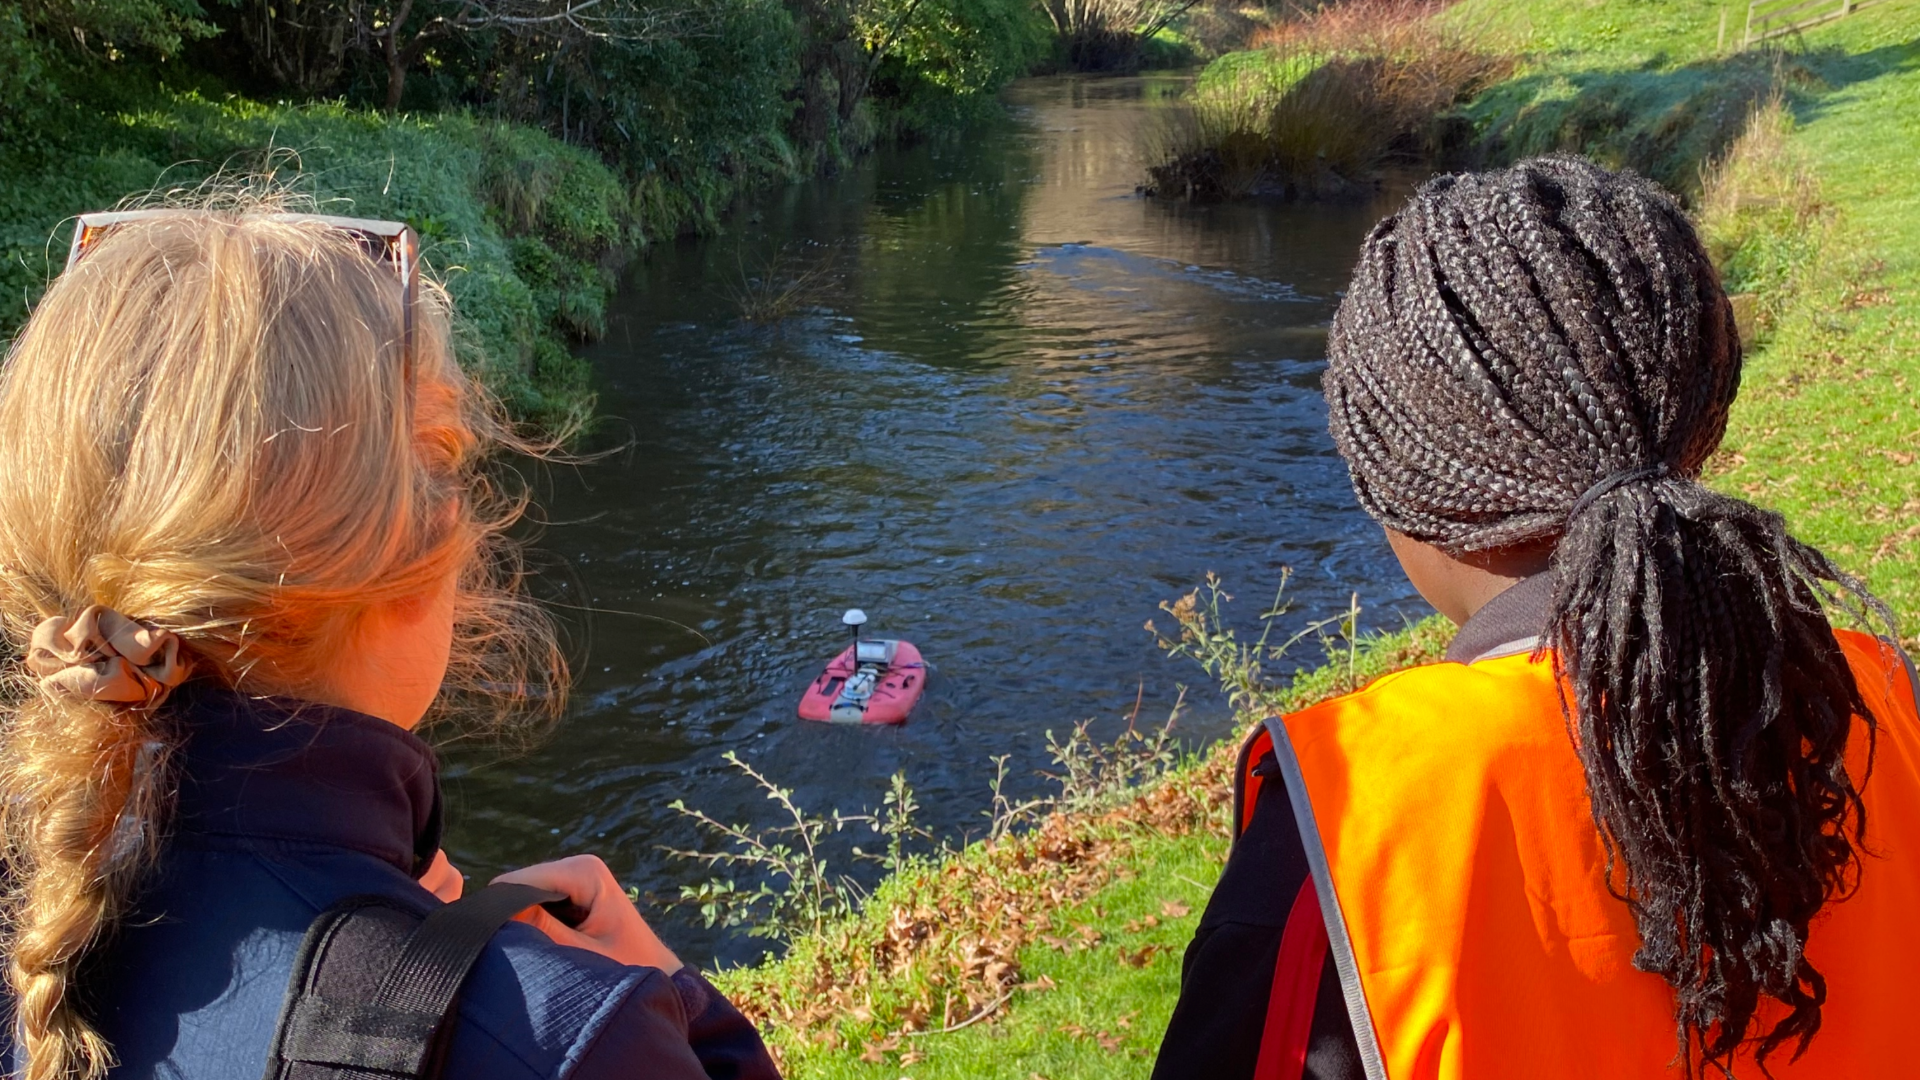
They can be mounted on a variety of objects and vessels including buoys, boats, jet skis, and even what looks like a remote-controlled boogie board – the RQpod.
“Using a boat like the RQpod means we can measure discharge in some of our bigger rivers where we aren’t able to wade across or access both sides of the river. The boats are crucial for insuring we can get measurements when rivers are in flood,” Jessie says.

