

Groundwater availability
Why we monitor groundwater availability
Aquifers provide natural water storage underground, holding ‘usable’ volumes of water, or groundwater, within rock cracks or porous sediments (such as sand and gravel).
Groundwater makes up about 90 per cent of our region’s freshwater resource. It is used for drinking, industry, agriculture and horticulture.
Waikato Regional Council monitors ‘available’ levels of groundwater to ensure groundwater resources are used sustainably.
‘Available’ groundwater is the total volume of groundwater that can be taken from an aquifer without affecting the aquifer. This simple assessment of available groundwater treats the aquifer in isolation to any connected streams and rivers.
As more water is taken from an aquifer, the volume of ‘available’ groundwater for future use drops. We estimate the level of stress on groundwater resources by comparing the volume of ‘available’ groundwater to the volume that’s already been allocated for use.
When too much groundwater is taken from aquifers:
- groundwater levels decline.
- there may not be enough water for everyone to use, resulting in competition for water.
- less groundwater flows into streams. Low stream levels can affect stream-life such as fish and invertebrates.
- land may subside.
- Salt water in coastal areas may flow into coastal aquifers and contaminate groundwater as the water table drops.
Results - data and trends
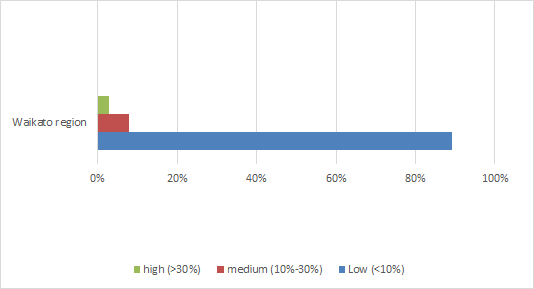
Waikato Regional Council divides the groundwater resources we monitor in our region into three categories: low, medium and high stress.
- Low stress areas have less than 10 per cent of available groundwater allocated for use.
- Medium stress areas have between 10 and 30 per cent of available groundwater allocated for use.
- High stress areas have more than 30 per cent of available groundwater allocated for use.
Areas listed as having low or medium stress may still be having a significant impact on nearby streams and rivers.
The impact on streams and rivers is managed separately through the resource consent process, when people request to take groundwater.
The graph below shows the percentages of low, medium and high level groundwater use across the areas we monitor. The Excel data file contains the source data for this indicator's information.
Percentage of investigated areas with low, medium or high groundwater use

Methods - how we monitor
More information
When this indicator is updated
This indicator is updated three years.
Last updated July 2017
Resources and supporting information
- Technical Report 2007/47 - A model for assessing the magnitude of unconsented surface water use in the Waikato region
- Waikato Regional Plan - Table 3-6 - Sustainable yields from aquifers
- Waikato Regional Plan - Water allocation maps