Sulphur dioxide levels in air
What is sulphur dioxide?
Sulphur oxides have a strong, unpleasant smell, and can harm people’s health and our environment.
Sulphur dioxide (SO2) is a potent respiratory irritant, and has been associated with increased hospital admissions for respiratory and cardiovascular disease, as well as mortality.
People most sensitive to sulphur dioxide include asthmatics and those with chronic obstructive lung disease.
The main source of sulphur oxides in urban areas is from combustion of fossil fuels such as coal and oil.
Highest concentrations of sulphur dioxide are likely to occur in or near urban areas where there is a high density of domestic home heating and adjacent to industrial sources.
Results - data and trends - sulphur dioxide levels
Waikato Regional Council no longer monitors levels of sulphur dioxide in air.
The sulphur dioxide levels indicator was last updated in August 2020.
Sulphur dioxide (SO2) was measured in Hamilton from 1 March 2012 to 31 August 2012 and in Tokoroa from 1 December 2017 to 31 May 2018.
The Waikato Regional Plan sets guideline concentrations for sulphur dioxide at 350 µg/m3 for a one hour average and 120 µg/m3 for a 24 hour average.
In 2005 the Government set National Environmental Standards (NES) for air quality including a standard for sulphur dioxide of 350 µg/m3 for a one hour average. It allows nine hours per year when concentrations can be greater than 350 µg/m3 with an upper limit of 570 µg/m3 with no allowable exceedances.
We separated sulphur dioxide levels into categories relative to the regional or national guideline.
Domestic home heating is typically the main contributor to sulphur oxides in urban areas in the Waikato region. In comparison, industry and transport are minor contributors. There has also been a decreasing contribution from transport because of the introduction of low sulphur petrol and diesel from around 2006 onwards.
The Waikato Hospital was considered to be a significant source of sulphur dioxide in the airshed as a result of combustion of coal in the hospital’s boilers. The coal fired boilers were replaced with gas fired boilers over a staged period in 2012 ending around May 2012.
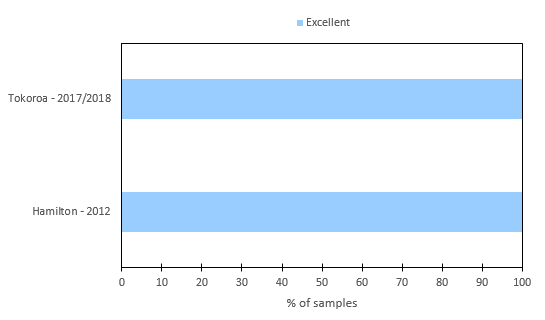
Results showed levels of sulphur dioxide were very low and fell entirely within the excellent air quality category in both Hamilton and Tokoroa.
The table and graph below show the percentage of air samples with sulphur dioxide levels in the ‘excellent’, ‘good’, ‘acceptable’, ‘alert’ and ‘action’ categories relevant to the regional and national guidelines for the year 2012 as measured at the Ohaupo Road (Blood bank) monitoring station.
Tokoroa results are measured at the Billah Street reserve monitoring station 2017 to 2018. All samples were within the ‘excellent’ category. Data for the 1 hour average are presented relative to the regional and national guideline of 350 µg/m3.
The data file contains the source data for this indicator's information.
Table 1: comparison of one-hour average sulphur dioxide levels measured in Hamilton (2012) and Tokoroa (2017-2018) to air quality indicator categories.
| Site |
"Excellent" 0-10% of guideline |
"Good" 0-33% of guideline |
"Acceptable" 33-66% of guideline |
"Alert" 66-100% guideline |
"Action" >100 % of guideline |
| Hamilton 2012 | 100% | 0 | 0 | 0 | 0 |
| Tokoroa 2017-2018 | 100% | 0 | 0 | 0 | 0 |
Percentage of air samples with sulphur dioxide levels in the excellent, good, acceptable, alert, or action categories

Methods - how we monitored sulphur dioxide levels
Data and trends - sources of sulphur oxides in air
Waikato Regional Council no longer monitors sources of sulphur oxides.
The sulphur oxide sources indicator was last updated in December 2008.
This indicator estimated the proportion of sulphur oxides in the air coming from industry, motor vehicles and home heating in the Waikato region.
The graph below shows that local industry was an important source of sulphur oxides in Te Awamutu and Putaruru. Tokoroa, Taupō, Te Kūiti, Waihi, Matamata, Ngāruawāhi and Turangi, motor vehicles were the main source of sulphur oxides. In Hamilton, industry and home heating were almost equal sources of sulphur oxide.
The data file contains the source data for this indicator's information.