

Particle levels in air (PM10 and PM2.5)
Why we monitor particle levels in air
These very fine particles can remain suspended in the atmosphere for long periods of time. Health effects associated with exposure to particles range from increased coughs and respiratory complaints to cardiovascular diseases, asthma, bronchitis, premature mortality and lung cancer. Susceptible people include the young and elderly and those with pre-existing medical conditions.
Although air pollution is a complex mixture of contaminants and particles generated from both natural and human created sources, the main air quality indicator of focus for monitoring and management in New Zealand has been PM10 (particulate matter less than 10 micrometres in size, about a fifth the width of a human hair.)
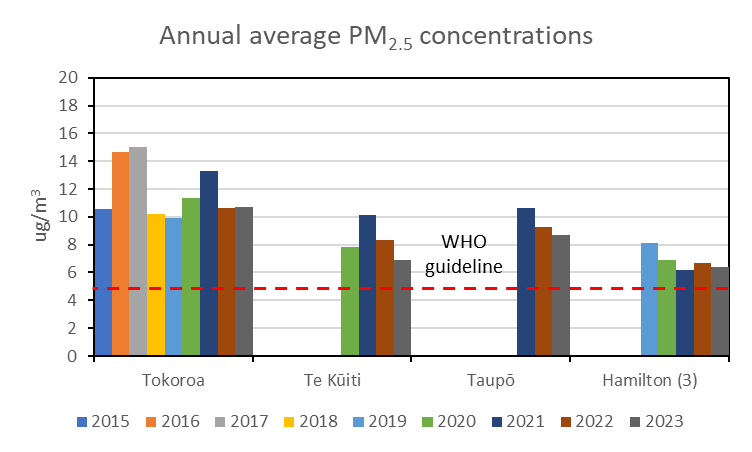
However, while PM10 levels pose a risk to human health, it is now well established that the finer particle range, referred to as PM2.5 (particulate matter less than 2.5 micrometres in size) provides better evidence of effects on human health and is more indicative of the problem source, which is combustion related.
Waikato Regional Council measures the amount of both PM10 and PM2.5 in the air.
Results - data and trends - particle levels
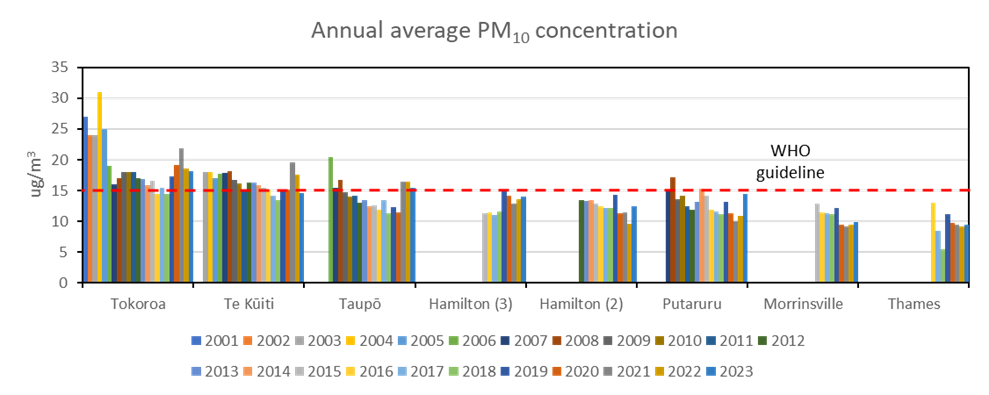
In our region, PM10 and PM2.5 levels are generally good or acceptable for much of the year. However, during cold, still days over winter when pollutants can become trapped close to the ground as a result of inversion layers, concentrations can approach or exceed the National Environmental Standard, Regional guidelines and World Health Organisation guidelines.
During winter, the majority of PM10 and PM2.5 in the region's urban areas comes from home fires, mainly from burning wood. Other sources such as industry and emissions from motor vehicles can also contribute to air pollution.
The Excel data file below contains the source data for this indicator's information.

Methods - how we monitor particle levels
Data and trends - sources of particles in air
Waikato Regional Council no longer monitors sources of particles in air.
The sources of particles indicator was last updated in December 2008.
We previously estimated the proportion of PM10 in the air coming from industry, motor vehicles and domestic heating in the Waikato region.
- In Hamilton around 70 per cent of particles in the air came from home fires with outdoor rubbish burning and motor vehicles each contributing just over 10 per cent.
- In Taupō, Tokoroa, Turangi, Ngāruawāhia and Matamata domestic fires contributed around 90 per cent of the particles.
- In Te Kūiti, Putaruru, Waihi and Te Awamutu the contribution of domestic fires was less, at around 60 to 70, with industry contributing around 20-40 percent.
The graph below shows the percentage of particles in air from home heating, motor vehicles, industry and outdoor burning. The data file contains the source data for this indicator's information.
How we monitored sources of particles in air
More information
When this indicator is updated
This indicator is updated every year.
Last updated June 2024