Ozone levels in air
What is ozone?
Ozone in the lower atmosphere is an air pollutant that can impact on our health.
Ozone in the air is primarily formed through reactions involving nitrogen dioxide (NO2), volatile organic compounds (VOC) and oxygen, which occur in the presence of sunlight. The main sources of NO2 and VOC are:
- motor-vehicle emissions and other combustion sources
- industrial and domestic use of solvents and coatings.
Results - data and trends
Waikato Regional Council no longer monitors ozone levels in air.
This indicator was last updated in February 2009.
Waikato Regional Council measured the hourly average levels of ozone in the surrounding air at a site in Hamilton.
Ozone was monitored in Hamilton because this is the area where the greatest number of people would be exposed to concentrations of ozone. Monitoring was carried out during the summer months when ozone concentrations were likely to be highest.
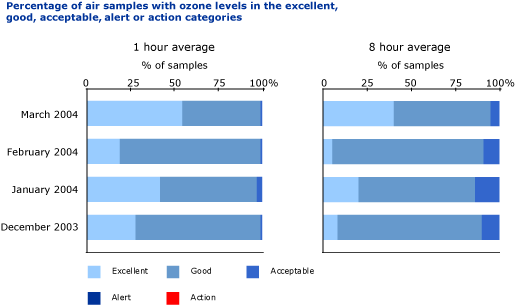
The graphs below show the percentage of air samples with ozone levels in the 'action', 'alert', 'acceptable', 'good' or 'excellent' categories relevant to the regional guideline.
Most of the time, ozone concentrations in Hamilton were excellent or good. Only around 10 per cent of the ozone levels measured over an eight-hour period and 2 per cent of the levels measured over a one-hour period were higher than a third of the regional guideline.
The levels did not exceed two-thirds of the regional guideline.
Higher concentrations of ozone may occur downwind of Hamilton in the rural areas.
The data file contains the source data for this indicator's information.


