Carbon monoxide in air
What is carbon monoxide?
Carbon monoxide (CO) is a poisonous gas that is colourless, odourless and tasteless. It’s associated with areas of high-density housing and busy roads.
Most of the carbon monoxide comes from motor vehicles and the burning of solid fuels, for example, burning wood and coal for domestic home heating and industry . Smaller amounts of CO are given off by gas burners and appliances.
Carbon monoxide is poisonous because it attaches to our red blood cells better than oxygen - reducing the blood’s ability to carry oxygen around the body. Low exposure to carbon monoxide causes headaches, dizziness and nausea.
High exposure to carbon monoxide (for example, high concentrations present in enclosed areas) causes loss of consciousness and death.
Normally, when there is plenty of oxygen present, burning fuel will give off carbon dioxide (CO2). The carbon (C) comes from the fuel and the oxygen (O2) comes from the air. But, when there’s not enough oxygen present, only one oxygen molecule binds with a carbon – forming carbon monoxide (CO).
Data and trends - carbon monoxide levels
Waikato Regional Council no longer monitors carbon monoxide levels.
The carbon monoxide levels indicator was last updated in June 2014.
Carbon monoxide (CO) was measured in Hamilton on an annual basis over the period 1998 to 2005 and more recently over short 3-monthly periods in 2012, 2013 and 2014. Results showed existing levels were either excellent or good, indicating that carbon monoxide is not of concern in Hamilton.
The Waikato Regional Plan sets guideline concentrations for carbon monoxide at 30 mg/m3 for a one hour average and 10 mg/m3 for an eight hour average.
The National Environmental Standards for air quality include a standard for CO of 10 mg/m3 (eight hour average). This can be exceeded no more than once per year. We separate carbon monoxide levels into categories relative to the regional and national guideline.
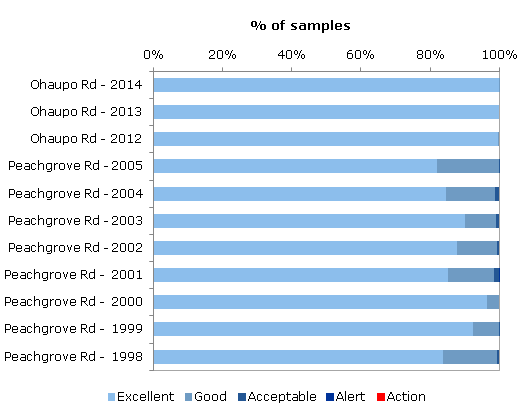
The graph below shows the percentage of air samples (eight-hour average) with carbon monoxide levels in the ‘excellent’, ‘good’ and 'acceptable' categories. No samples had carbon monoxide levels in the ‘alert’, or ‘action’ categories.
The data was collected in 1998, 1999, 2000, 2001, 2002, 2003, 2004, 2012, 2013 and 2014, and averaged 1 and 8 hourly.
The data file contains the source data for this indicator's information.
Percentage of air samples with carbon monoxide levels in the excellent, good and acceptable categories

Methods - how we monitored carbon monoxide levels

Data and trends - sources of carbon monoxide
Waikato Regional Council no longer monitors sources of carbon monoxide emissions.
The carbon monoxide sources indicator was last updated in December 2008.
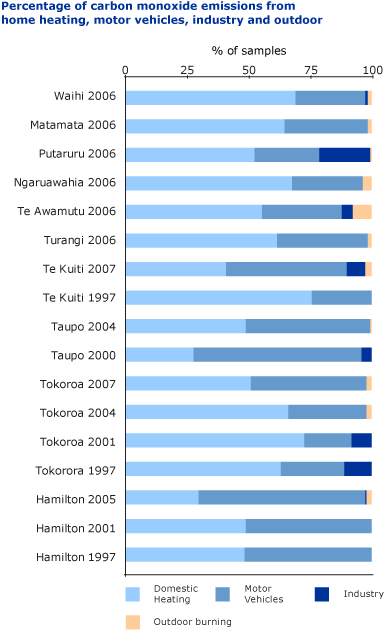
The graph below shows that in Hamilton and Te Kūiti, motor vehicles contribute the highest amounts of CO to the air. In Tokoroa, Waihi, Matamata, Putaruru, Ngāruawāhia , Te Awamutu and Turangi home heating contributes the most carbon monoxide. In Taupō motor vehicles and domestic heating contribute almost equally to carbon monoxide concentrations.
The data file contains the source data for this indicator's information.