

Benzene levels in air
What is benzene?
Benzene is an air contaminant that is produced by combustion processes such as burning fuels for transportation and heating and as a result of evaporative emissions.
Small amounts of benzene are present in petrol. Benzene is also used in the manufacture of plastics, detergents, pesticides, and other chemicals.
Benzene is a known carcinogen, which means exposure to benzene over a long period of time, or to high enough concentrations can increase the risk of developing cancer.
At higher concentrations, the major effect of long-term exposure to benzene is on blood. Benzene causes harmful effects on bone marrow and can cause a decrease in red blood cells leading to anaemia. It can also cause excessive bleeding and can affect the immune system, increasing the chance for infection.
Short-term exposure to high levels of benzene can cause drowsiness, dizziness, unconsciousness and death.
Results - data and trends
Waikato Regional Council no longer monitors benzene levels.
This indicator was last updated in June 2021.
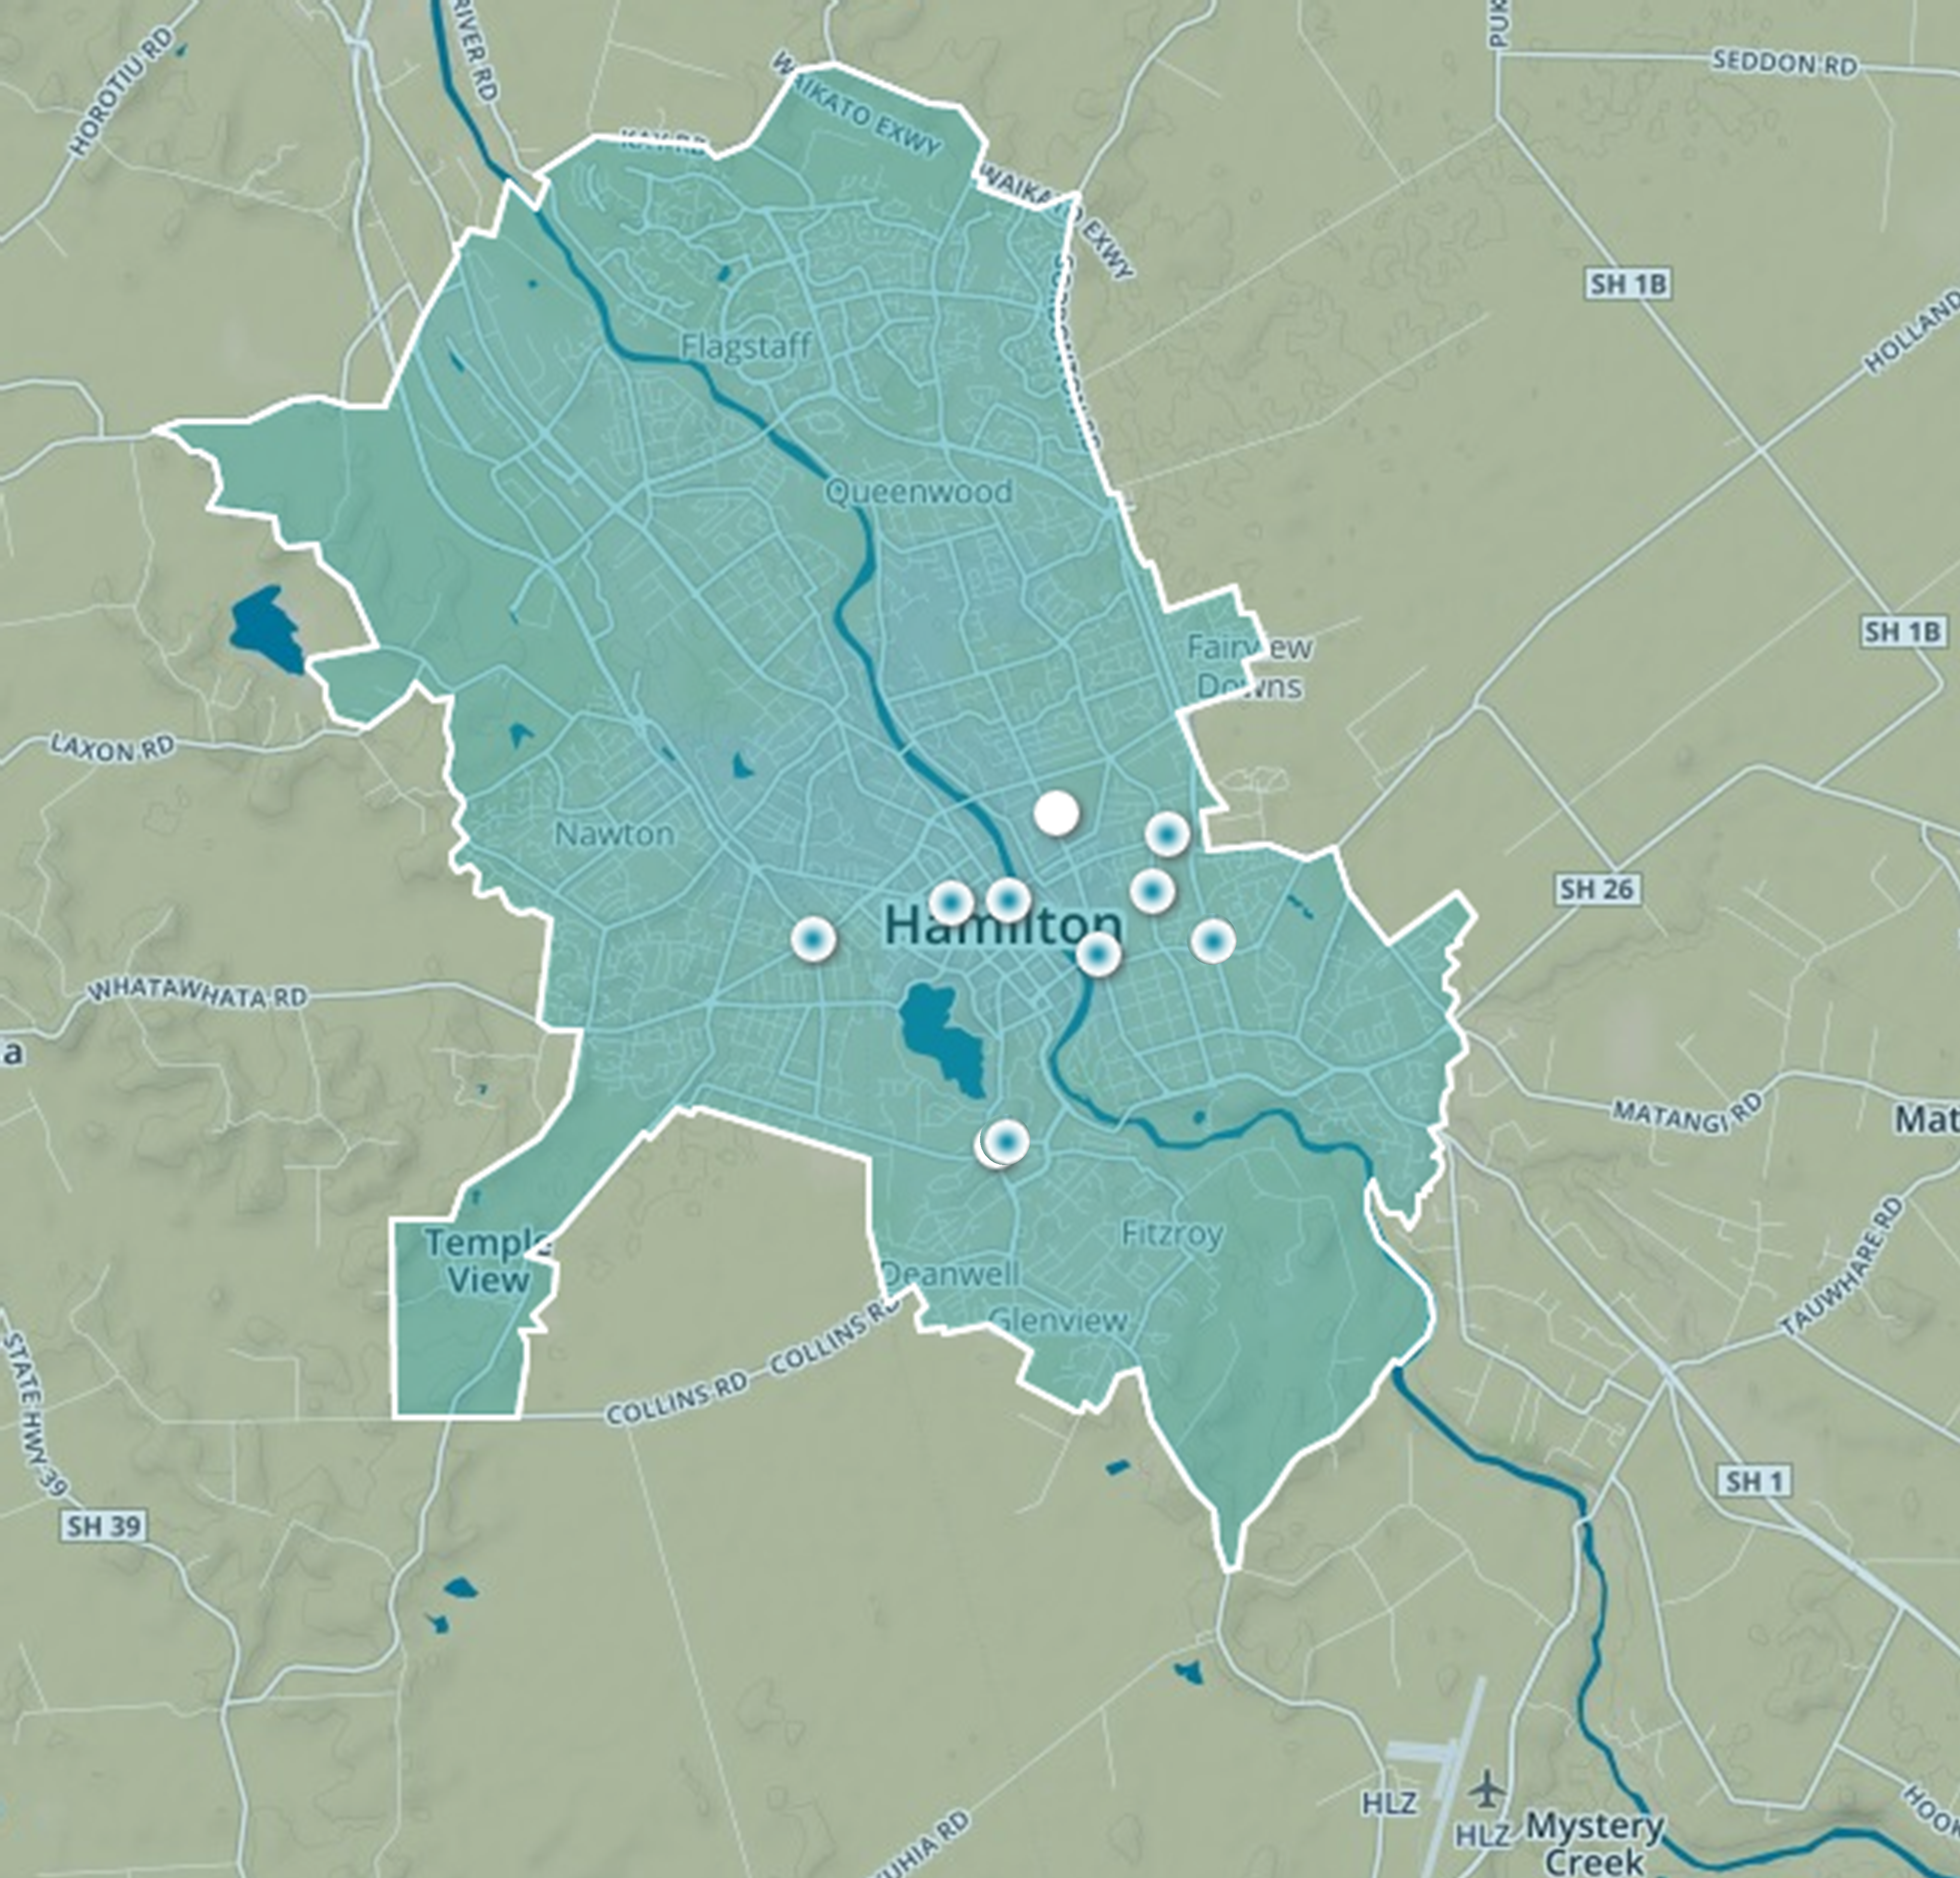
Waikato Regional Council monitored concentrations of benzene in Hamilton and Tokoroa.
Benzene was measured in Hamilton because this is the area where the greatest number of people are exposed and is the area where concentrations are likely to be the highest.
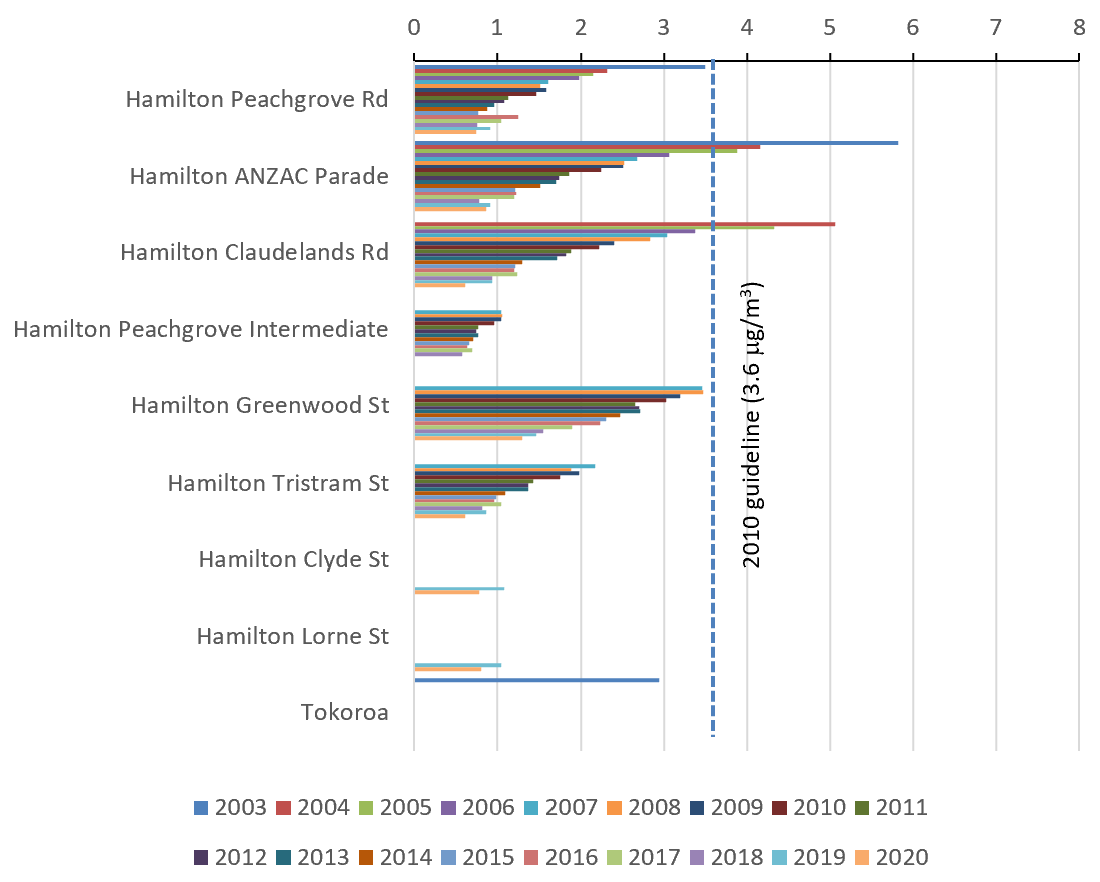
We measured three-month average levels of benzene at eight sites in Hamilton, over the period 2003-2020.
The main sources of benzene in Hamilton city were motor vehicles and domestic fires.
Monitoring results showed that from 2003 to 2005 benzene measured at ANZAC Parade and Claudelands Road, two high-density traffic sites in Hamilton, would have breached the current National Ambient Air Quality Guideline for benzene, which is 3.6 µg/m3 (annual average).
Results indicated a decreasing trend in benzene concentrations which is likely to have been caused by a reduction of benzene in petrol over this monitoring period. From 2006-2020 ambient concentrations were lower than the guideline of 3.6 µg/m3 at all eight Hamilton sites.
The graph below shows the average benzene levels in Hamilton and Tokoroa sites. The Excel data file contains the source data for this indicator's information.
Annual average benzene levels (μg/m3) in Hamilton and Tokoroa for 2003-2020

How we monitored benzene levels in air
More information
Footnotes
1. Stevenson, C. and Narsey, H. 1999: Survey of Benzene and Other Toxic Organic Compounds in Air: July